
Telecom
Linear survey, route maps and POP survey
Linear survey and mapping with RGB and LiDAR, route maps in ring form, POP survey using LiDAR or RGB, GPR survey and monitoring, digitisation, and feature identification in the web visualisation tool. Inspection markers on a tower view are illustrative and are not a named site.
GPR survey and monitoring sit with the ring route map and the POP survey. Tower markers on the homepage are illustrative inspection points.
Step by step
How a route and tower survey is read
Illustrative sequence. Figures inside each clip are sample interface text, not a measured result.
-
01
Desktop planning (DTP)
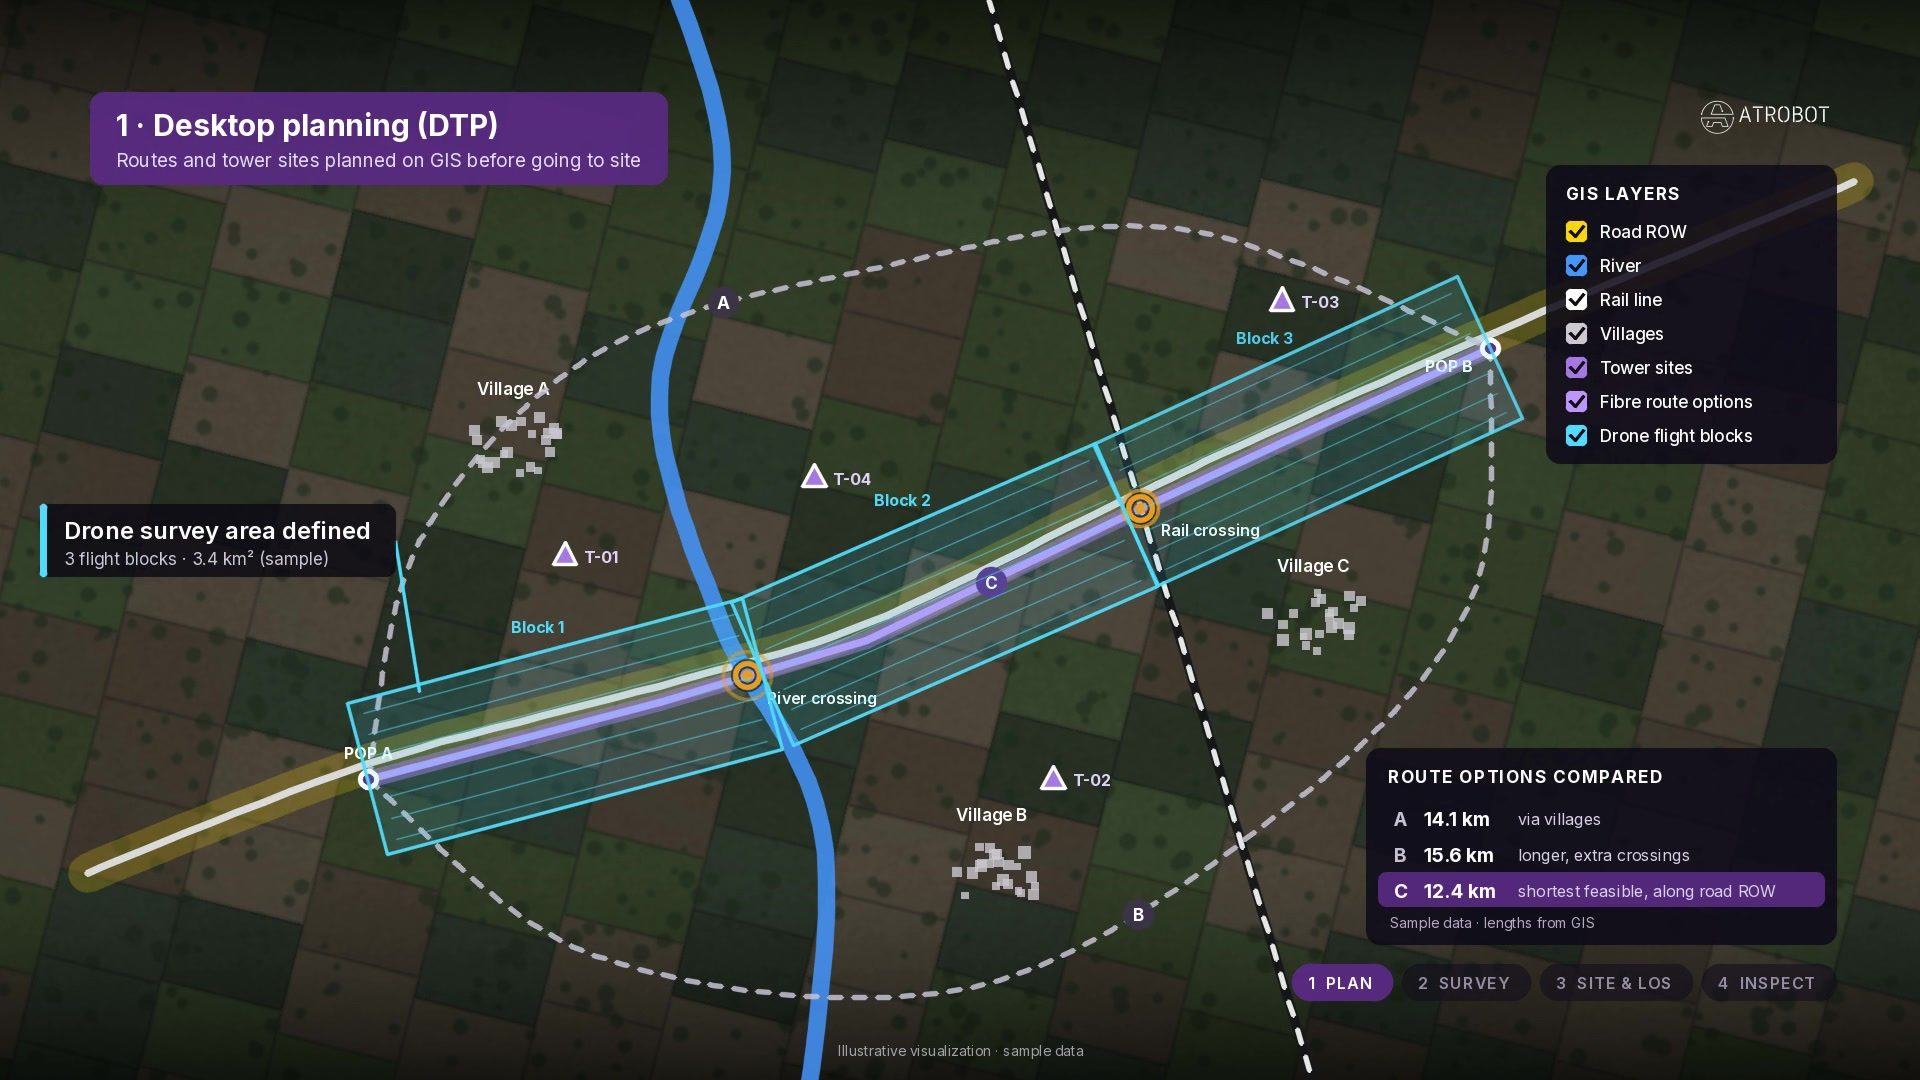
Routes and tower sites are planned on GIS before going to site, comparing fibre/route options against villages, river and rail layers. Kilometre lengths in the comparison table are sample interface text.
-
02
Fibre route survey
The drone maps the corridor so every crossing and utility conflict is located along the right-of-way. Chainage and GSD readouts are sample interface text.
-
03
Tower site & line-of-sight
3D terrain checks the microwave path and coverage between an existing tower and a candidate hilltop site. Elevation labels are sample interface text.
-
04
Tower inspection · RGB orbit
The drone circles the tower close and steady for RGB inspection of antennas and structure. Altitude and distance HUD values are sample interface text.
-
05
Thermal view
Overheating radios show up before they fail on the thermal IR view of the same tower. Delta-temperature callouts are sample interface text. Note: source clip may show thermal on the drone — site must mask thermal off any drone.
-
06
Digital twin / close-out
Inspection findings feed into a digital twin style close-out of the tower asset for maintenance follow-up. Any asset IDs shown are sample interface text.
Telecom Corridor & Tower Decision Matrix
From ring-route and tower capture to digital twin & fiber GIS records
How Atrobot connects RGB, LiDAR and GPR field surveys with AI feature extraction for telecom towers and optical-fiber corridors.
-
Step 01 · Route Survey
Corridor RGB, LiDAR & Subsurface GPR
Linear aerial mapping along proposed fiber rings combined with Ground Penetrating Radar (GPR) and POP site surveys.
RGB + LiDARGPR Utility ScanPOP SurveyAI Layer · Corridor MappingRight-of-Way & Utility Conflict Extraction
Identifies road crossings, bridges, existing underground utilities, terrain slopes and parcel boundaries along the fiber route.
RoW ClassificationSubsurface MapGIS LayersImpact · Route DesignFaster Fiber Rollout & Fewer Trench Strikes
Delivers accurate ring-route CAD/GIS sheets that prevent costly utility strikes and accelerate right-of-way approvals.
Reduced ReworkDPR Ready -
Step 02 · Tower Capture
360° Vertical Tower & Antenna Flights
Multi-altitude orbital flights capture every cross-arm, microwave dish, RF sector antenna, mount and foundation bolt.
Orbital FlightHigh-Res RGBThermal CheckAI Layer · Structural Twin3D Tower Digital Twin & Inventory AI
Reconstructs a measurable 3D tower model to extract antenna height, azimuth, tilt, rust/corrosion and missing hardware.
Antenna Tilt/AzimuthRust Detection3D Point CloudImpact · Structural HealthClimb-Free Tower Audits & Co-Location
Engineers verify available wind-load capacity, tenant inventory and structural integrity from the desktop without tower climbs.
Zero Climb RiskExact Asset Register -
Step 03 · Maintain
Centralized Cloud GIS & Change Monitoring
All route corridors, POP records and tower inspection datasets are indexed in the Geospatial Visualisation workspace.
Cloud StorageMulti-Site GISAudit LogAI Layer · Network AnalyticsAutomated Encroachment & SLA Reporting
Flags vegetation intrusion, corridor construction threats and structural drift across regional telecom portfolios.
SLA DashboardsAPI / ERP SyncAlertingImpact · UptimeResilient Network Infrastructure
Continuous visibility across thousands of linear kilometres and tower assets with instant engineering report export.
99.9% VisibilityPortfolio Scale
What this work covers
A route is planned on GIS, then surveyed with RGB, LiDAR or GPR. Digitisation and feature identification happen in the visualisation workspace.
The outcome is a ring route map, a POP survey and a GPR record. Lengths shown inside the step clips are sample interface text, not a measured result.
- PlanRoute options on GIS
- SurveyRGB, LiDAR and GPR
- DigitiseThe linear record
- IdentifyFeatures in the viewer
- Linear survey and mapping with RGB and LiDAR
- Route maps in ring form
- POP survey using LiDAR or RGB
- GPR survey and monitoring
- Digitisation of data
- Feature identification on the web visualisation tool
Survey work
FAQ
Frequently asked questions
Linear survey and mapping with RGB and LiDAR, route maps, POP survey, GPR survey and monitoring, digitisation, and feature identification in the web visualisation tool.
Next step
Request a Consultation
The enquiry goes to business@atrobot.in. You can also call +91-9319044881.