
Solar Solutions & Spatial Capabilities
Solar array inspection and how the spatial record is delivered
DGPS surveys and drone-based aerial mapping collect the record. Processing produces maps, contours and measurements, then a GIS dashboard and a stored report. Drone capture is one survey method.
The delivered record can include an orthophoto, DSM and DTM contours, a point cloud and a report kept in cloud storage.
Step by step
How an array inspection is read
Illustrative sequence. Figures inside each clip are sample interface text, not a measured result.
-
01
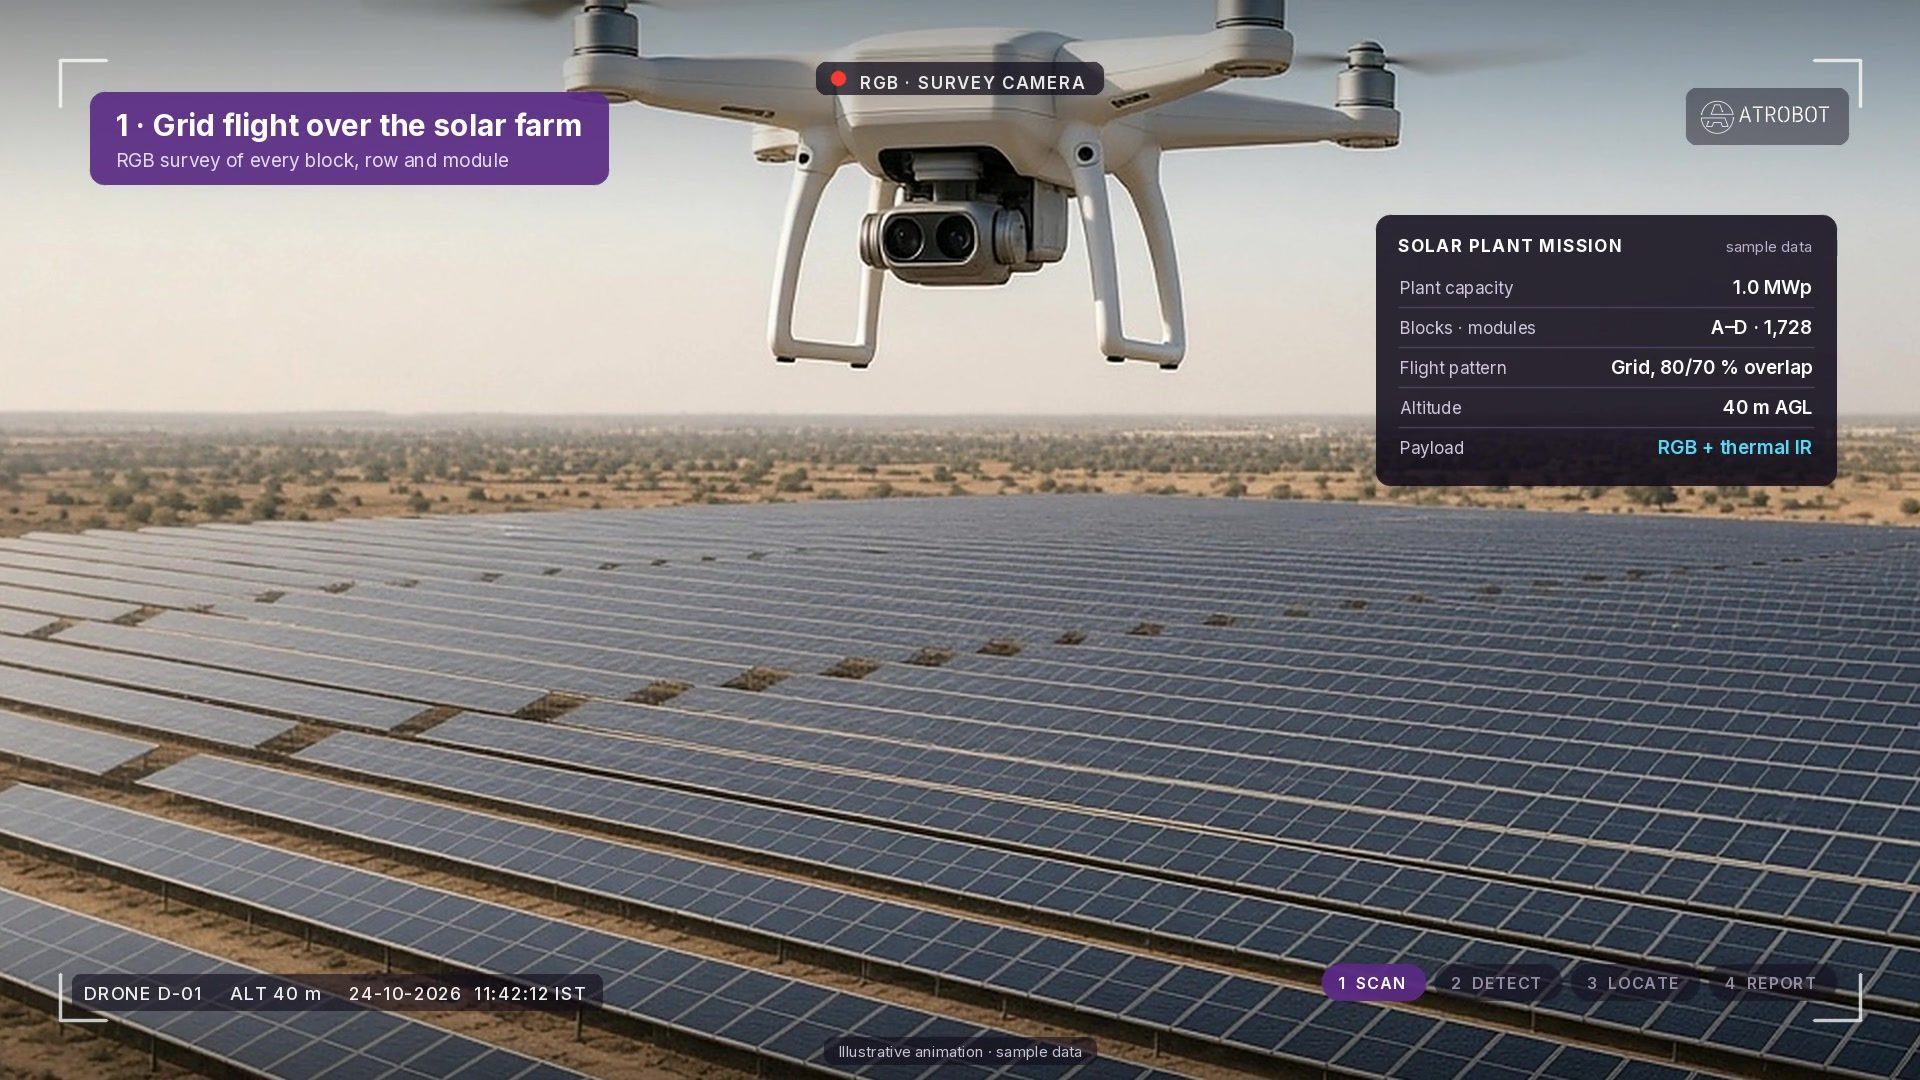
Grid flight over the solar farm
RGB survey of every block, row and module on a planned grid flight. Plant capacity and module counts shown are sample interface text.
-
02
Thermal fault detection
AI classifies hotspots, diode failures, soiling, cracks and offline strings on the radiometric thermal view. Delta-T values are sample interface text.
-
03
Every fault geotagged
Faults are pinned on the plant layout by block, row and module ID so O&M crews can find them. Module IDs are sample interface text.
-
04
Locate / repair report
Closing step packages geotagged findings into a crew-ready report for repair follow-up. Any repair metrics on screen are sample interface text.
Solar & Spatial Intelligence Flowchart
From grid flight capture to crew-ready solar O&M and GIS records
How Atrobot connects automated aerial capture, radiometric thermal AI and cloud GIS validation into measurable plant performance.
-
Step 01 · Capture
Autonomous Grid Flight & DGPS Control
RTK/DGPS-referenced RGB and radiometric thermal flights cover every inverter block, tracker row and module string alongside ground survey control.
RGB + ThermalDGPS GCPFlight QAAI Layer · AlignmentOrthomosaic & Thermal Co-Registration
Pixel-accurate alignment of high-resolution RGB orthophotos, DSM/DTM elevation models and calibrated temperature layers across the plant.
GeoTIFFDSM / DTMLAS / LAZImpact · Baselines100% Plant Digital Twin & As-Built CAD
Complete georeferenced plant layout with verified string boundaries, drainage slope contours and cloud-archived baseline records.
Zero Blind SpotsCloud GIS Record -
Step 02 · Inspect
Radiometric Thermal & Anomaly Scan
Frame-by-frame radiometric inspection across solar arrays to isolate cell hotspots, bypass diode failures, soiling, delamination and offline strings.
Delta-T AnalysisString ScanIEC StandardsAI Layer · ClassificationAutomated Defect & Severity Grading
Computer-vision models classify thermal anomalies by root cause and temperature delta, filtering false reflections and pinning exact module IDs.
Hotspot AIDiode / StringModule PinningImpact · Yield RecoveryTargeted O&M Dispatch & MWh Recovery
Field technicians receive block, row and module coordinates on mobile/web GIS—cutting diagnostic walk-time and preventing string downtime.
Fast Crew DispatchPreventive O&M -
Step 03 · Deliver
Multi-Epoch Verification & Reporting
Repeat inspection flights and land/corridor surveys track repair completion, vegetation shading and earthwork drainage across seasons.
Change DetectionQA AuditCloud ArchiveAI Layer · AnalyticsInteractive Web GIS & Executive Reports
Browser-based 2D/3D visualisation workspace links every fault ticket, contour sheet, volumetric check and historical inspection log.
Web DashboardPDF / CSV / SHPAudit TrailImpact · Asset LifecycleProtected Plant Availability & Compliance
Permanent, auditable spatial record supporting warranty claims, commissioning sign-off and portfolio-wide asset management.
Warranty ProofPortfolio Analytics
Workflow
Collect, process, check, deliver
- CollectDGPS and aerial mapping
- ProcessMaps, contours and clouds
- CheckImage and data checks
- DeliverReport and cloud storage
The outcome is the spatial record: maps, contours, point clouds, measurements and a report kept in cloud storage. Figures inside the step clips are sample interface text.
Collect
DGPS surveys and drone-based aerial mapping, including flight planning as part of data collection. Collection includes image quality verification.
Process
Orthomosaic and 3D map generation, DSM and DTM contour mapping, and aerial image processing. Geospatial Visualisation & Analytics processes LAS and LAZ.
Check
Image quality verification during collection, and data-validation workflows in the visualisation software.
Deliver
Orthophoto maps, DSM and DTM contours, 3D maps, point clouds, measurements, route maps, and report generation and cloud storage.
Deliverables
- Orthophoto maps, orthomosaics and 3D maps
- DSM and DTM contours
- Point clouds and a digital twin from airborne LiDAR
- Volume, slope, area, bench height, cross-sections and haul-road measurements
- Route maps, DPR preparation, bridge and building analysis, and BIM modelling
- Digitized land records and planning layers
- Report generation and cloud storage
Software that holds the record
FAQ
Frequently asked questions
DGPS surveys and drone-based aerial mapping. Drone capture is one survey method.
Orthophoto maps, orthomosaics, 3D maps, and DSM and DTM contours.
Next step
Request a Consultation
The enquiry goes to business@atrobot.in. You can also call +91-9319044881.